FinOps
Note: Previously named “Finances”. From v0.8.0, FinOps spans assessment, allocation, analysis, and upcoming optimization/monitoring.
Reply CMP FinOps helps you see where money goes across Azure, AWS, and GCP and makes it simple to hold teams accountable. You explore costs, allocate ownership with rules, and dig into drivers—all in one place.
How it works
FinOps in Reply CMP follows a lightweight lifecycle:
Assess gives you a high‑level picture of spend and trends.
Allocate maps resources to owners (Groups), Environments, and Projects, and tracks budgets.
Analyze lets you ask deeper questions with rich filters and groupings.
Optimize and Monitor (Preview) bring recommendations and continuous tracking.
Note
Cost data refreshes daily and includes charges up to the previous day (T‑1). Providers often revise (backfill) prior days as usage is finalized. Reply CMP automatically reconciles these retroactive updates, so recent historical values can change slightly as providers publish corrections. Intraday data is not available.
Note
Tenant currency: You can set a preferred currency at the tenant level. All FinOps views, budgets, and exports will display amounts in this currency.
Quick start
Connect your cloud providers in Tenant → Connections.
Open FinOps from the left navigation. Use the phase selector at the top (
Assess,Allocate,Analyze).Pick a time frame (for example, Last 30 Days) and a cost type (Actual or Amortized).
Start in Assess to get the landscape, then move to Allocate to define ownership, and use Analyze to answer specific questions.
Assess
Assess is the dashboard you check first. It summarizes:
Total cost, daily average, and last‑period comparison
Cost split by provider (Azure, AWS, GCP)
Daily cost trend for anomaly spotting
Breakdown by connection, category, and group
Look for changes rather than absolutes. A sudden bump in the daily trend or a category growing faster than others is a good reason to drill down.
Tip
Click provider badges in legends to toggle series on or off and isolate a signal.
Note
Switch Cost Type between Actual (raw, daily invoiced) and Amortized (commitments spread over time) to compare perspectives.
Allocate
Allocate is where cost ownership becomes explicit.
You build three orthogonal dimensions:
Groups: your organization tree (Company → BU → Product → Team—any depth) with optional owners
Environments: standard stages like dev, qa, prod
Projects: initiatives, applications, or workloads
Resources are assigned with rules so you don’t move them manually.
Budgets live on group nodes. Set a monthly or quarterly amount and watch utilization update as new data arrives.
Budgets
Budgets help owners keep spend on track for a group node.
Where it applies:
Scope is the selected Group node; the budget evaluates all costs allocated to that node across providers and connections.
Create a budget:
Open Allocate and select a Group node.
Click Add budget.
Set Amount (currency follows your tenant settings).
Choose Reset period (for example, Monthly; other cadences may be available).
Pick a Start date.
Note
The start date is fixed after creation and can’t be changed.
Save.
What you’ll see:
Overview: Current spend this period and utilization (e.g., €569.01 • 50% of budget) with a progress bar.
Thresholds: A list of alert thresholds and their status (Triggered when crossed).
Alerts and recipients:
Configure up to three thresholds per budget.
Tip
Common picks are 50%, 75%, and 90% of budget.
Threshold type: Percentage of the budget amount (alerts fire when utilization crosses the value).
Recipients: The Group owner receives alerts by default; add additional recipients as needed.
Escalate: If escalate is enabled, also the owner of the ancestor’s group will be notified for that alert.
Editing and lifecycle:
You can update the amount, thresholds, and recipients at any time.
The start date remains fixed; the reset period rolls the budget automatically at the end of each cycle.
Analyze
Analyze turns questions into views. You choose a time frame and granularity (Daily/Weekly/Monthly), then combine filters and up to two “Group by” dimensions (for example, Provider + Project or Group Level + Environment). The chart highlights trends; the table underneath gives the exact rows you can export.
Common flows:
Find top drivers: Group by Category → Resource Type; sort by cost.
Compare units: Group by Group Level + Environment to see how prod compares to dev across BUs.
Investigate a spike: Narrow the date range and group by Connection + Resource Name to isolate the source.
Tip
Use Tags in filters to align with your own taxonomy even when provider naming differs.
Optimize (Preview) and Monitor (Preview)
These phases introduce recommendations and alerting. The UI surfaces potential savings and will evolve toward scheduled notifications and policy‑driven tracking.
CMP Agent (Conversational FinOps Assistant)
Ask natural‑language questions from within FinOps and get an immediate breakdown. Useful for quick checks or sharing context in chats.
Example prompts:
“Provide a breakdown of costs for my groups in the last week.”
“Show monthly VM costs by region for prod.”
“Which resource group had the highest spend last month? List the top 5 resources.”
“Filter to GCP and show storage category spend by project.”
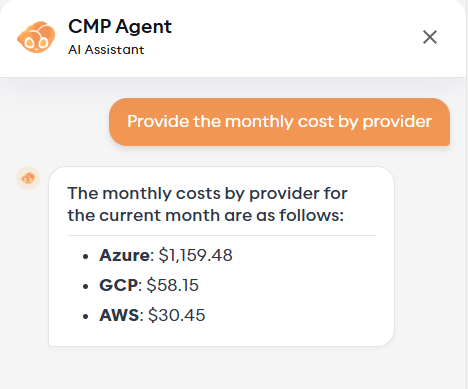
CMP Agent embedded in FinOps for quick, conversational queries.
Data timeline: Why “yesterday”?
See also
Costs refresh daily and typically include charges up to the previous day (T‑1). Cloud providers may publish corrections for the past 48–72 hours (backfills) as usage is finalized and commitments/credits are applied. Reply CMP ingests and reconciles these updates automatically, so recent historical values can adjust slightly over a few days. Intraday cost data is not available.
Currency and FX
Note
FinOps displays all amounts in your tenant currency. When providers export costs in native currencies, Reply CMP applies daily FX rates and standard rounding. Small differences versus provider portals can occur due to timing and rounding.
FAQ
How fresh is the data?
Daily, up to the previous day (T‑1). Providers may backfill previous days as they finalize billing; Reply CMP applies those corrections automatically, so values for recent days can change slightly. Intraday data is not available.
Why do past days sometimes change?
Cloud providers finalize and correct charges after initial export (for example, late usage arrival, commitment/reservation allocation, credits/adjustments). When those backfills are published, Reply CMP ingests and reconciles them, updating affected historical days to keep totals accurate.
Which currency is used? Can I change it?
All costs and budgets are shown in the tenant currency. An administrator can change the tenant currency in Tenant settings; once updated, the new currency is applied consistently across FinOps views and exports.
Actual vs Amortized—what’s the difference?
Actual shows the raw, daily invoiced cost. Amortized spreads committed costs across their benefit period.
What is connection‑level cost?
Overhead tied to a subscription/account/project rather than to a named resource (e.g. reservations, bandwidth costs, …). It’s shown separately and can be allocated.
Can a resource match multiple rules?
Yes. Dimensions are orthogonal. A resource can map to a Group node, an Environment, and a Project at the same time.
Can I export results?
Yes. Use Share or Export from Analyze to take the table elsewhere.
Glossary
Connection: a cloud account/subscription/project.
Category: normalized cost family (compute, storage, network, etc.).
Group: an organizational node with optional owner and budget.
Rule: one or more
key:valuetag matches that drive allocation.Connection‑level cost: provider/account overhead not tied to a specific resource.